GridIQ turns live GB carbon-intensity data into a scheduling decision. By shifting the same workloads to hours when the grid runs on more wind, solar and nuclear, organisations typically cut compute Scope 2 emissions by 25–40%† — without capex. Give it a job's duration and deadline and it finds the lowest-carbon window across all 14 grid regions.
The same job can emit several times more carbon depending on when and where it runs
Carbon intensity — grams of CO₂ per kWh of electricity — swings hour by hour and region by region as the GB generation mix shifts between wind, solar, nuclear and gas. A batch job that runs at the wrong time in the wrong region can carry a very different footprint from the identical job run a few hours later. GridIQ finds that better window for you.
◧
Reportable impact, quantified
kgCO₂e avoided per job, per region, per month. Boardroom-ready figures your ESG team can use for SECR, TCFD/ISSB and CSRD disclosure — without estimation or hand-waving.
⛨
Zero infrastructure risk
GridIQ sits on your platform so you're in total control. Workloads run at the same locations on the same infrastructure. You shift timing, not architecture. Ops teams manage the change; no capex approval cycle, no deployment risk and GridIQ doesn't see or access any of your job detail.
◈
Moves your needle
Re-timing removes roughly 45–75 tonnes CO₂e for every GWh of batch compute you shift†. Measurable progress toward net-zero 2030, with no new hardware.
▦
Optimise the whole schedule
Import your batch schedule straight from Control-M, AutoSys or IBM Workload Scheduler — or a simple CSV — and GridIQ optimises every job in one pass.
The net-zero dilemma
Reporting deadlines don't wait for new capacity
75%
of organisations will have implemented a data-centre infrastructure sustainability programme by 2027 — up from under 5% in 2022.
Gartner, 2023
945 TWh
projected global data-centre electricity consumption by 2030 — roughly double the 2024 figure.
IEA, 2025
27%
forecast growth in data-centre power demand in 2026 alone, from 104 GW to 132 GW.
Gartner, 2026
Most organisations face the same hard choice: renewable capacity takes two to three years to deliver, and reporting deadlines don't wait. You need measurable Scope 2 reduction now.
GridIQ solves this by highlighting which workloads to shift — and to when. Moving the same jobs to hours when the grid runs on more wind, solar and nuclear cuts their carbon without touching your infrastructure. Across the past year, a saving of more than 20% was available on more than eight days in ten†. Your team stays in control of execution: GridIQ recommends the window, you trigger the run. Measured operational abatement — not estimates, not offsets.
Live map
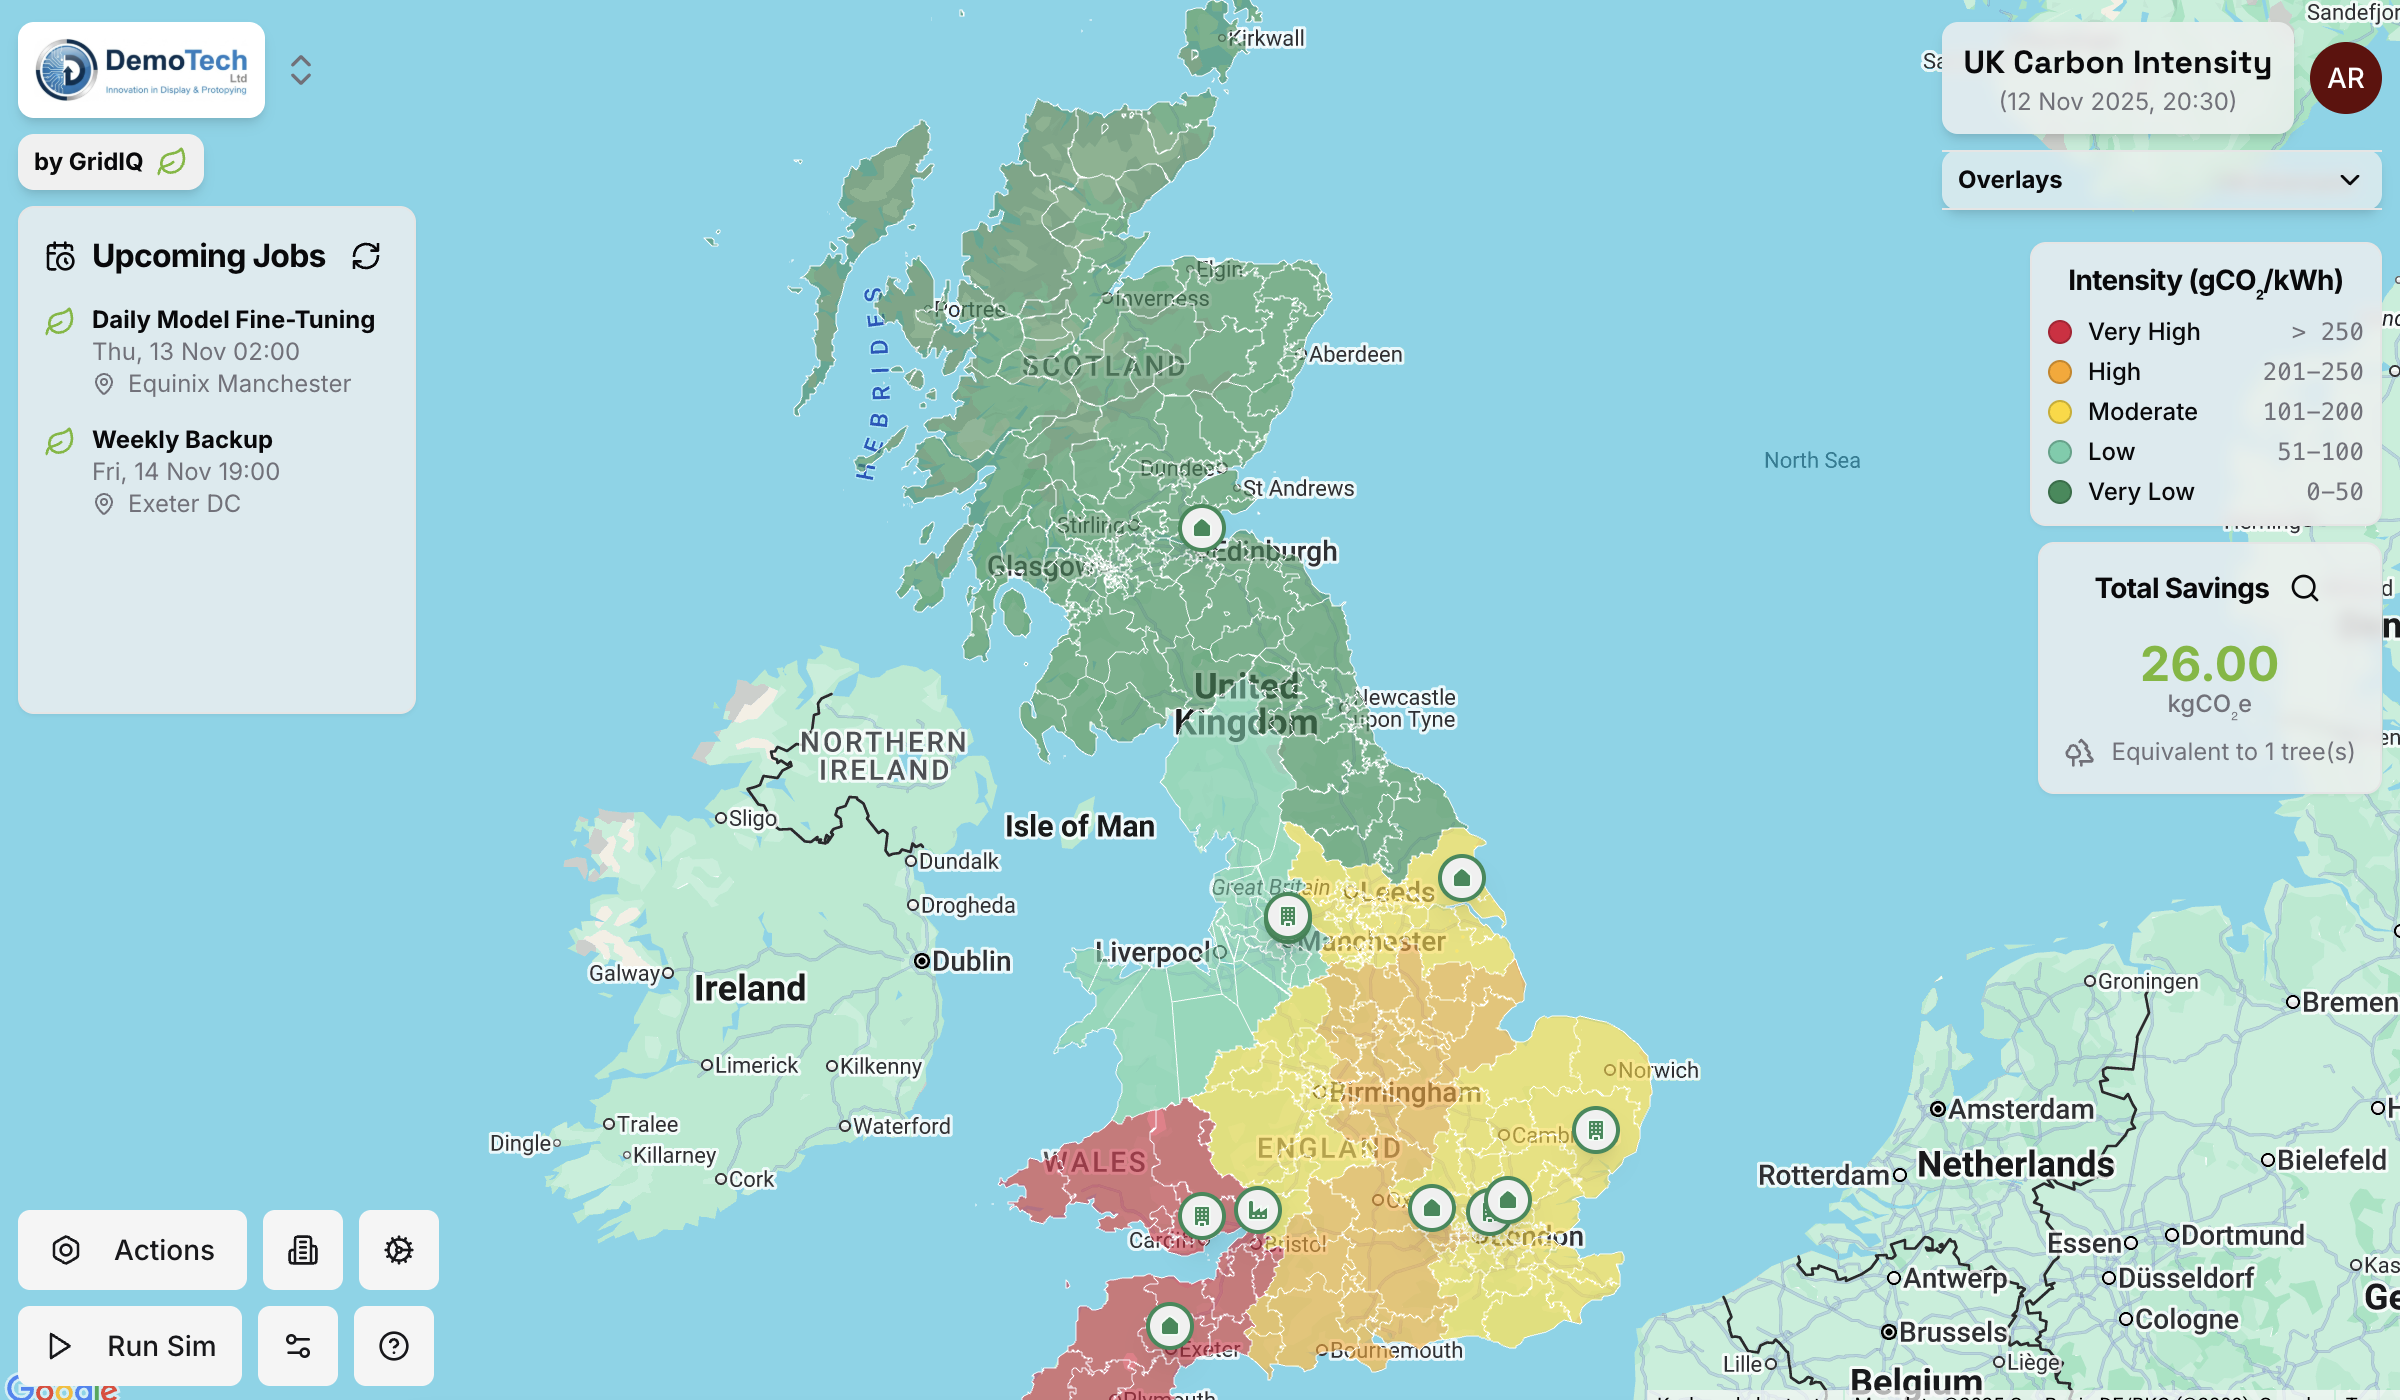
Visualise the grid, region by region
GridIQ maps live carbon intensity across Great Britain, colour-coded by region, so you can see at a glance where — and when — electricity is cleanest. Search any location or pick from a built-in library of UK data-centre sites.
Live + 48-hour forecast for all 14 GB regions
Historic data for siting and capacity decisions
Email alerts when intensity crosses your thresholds
Workload scheduler
From carbon data to a scheduling decision
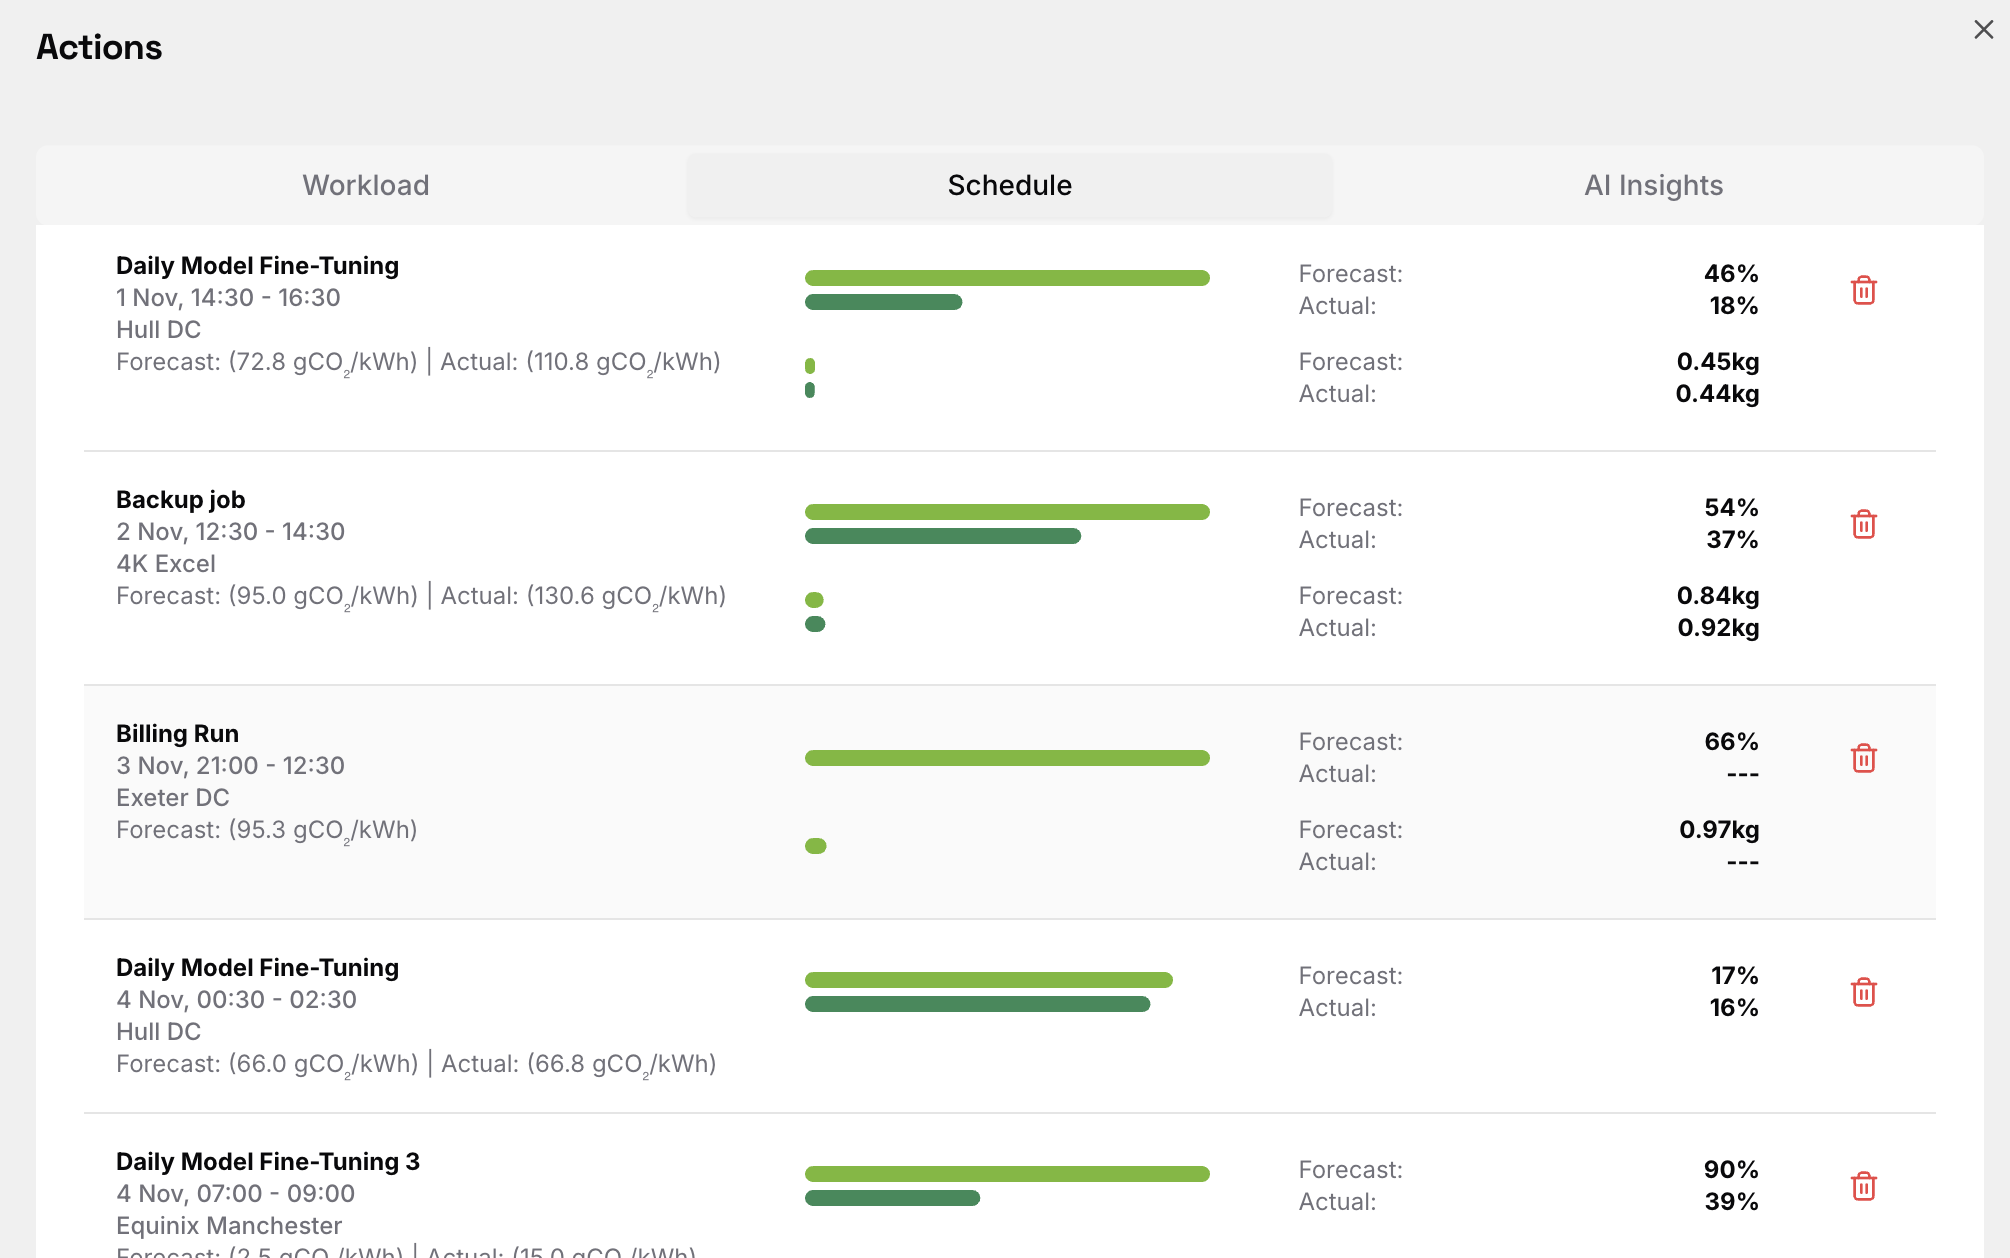
Pulling a carbon-intensity number is the easy 20%. GridIQ does the other 80%: it takes your job's duration, deadline and location, finds the lowest-carbon window in the next 48 hours, and lets you schedule it — one-off or recurring.
Forecasts shift. GridIQ keeps watching, and if a cleaner slot opens up before your job runs, it tells you — you decide whether to move.
One-off and recurring jobs
Timeline view comparing intensity across your locations
You stay in control — GridIQ tells you when, you trigger the run
Enterprise batch reporting
Bring your whole scheduler, not one job at a time
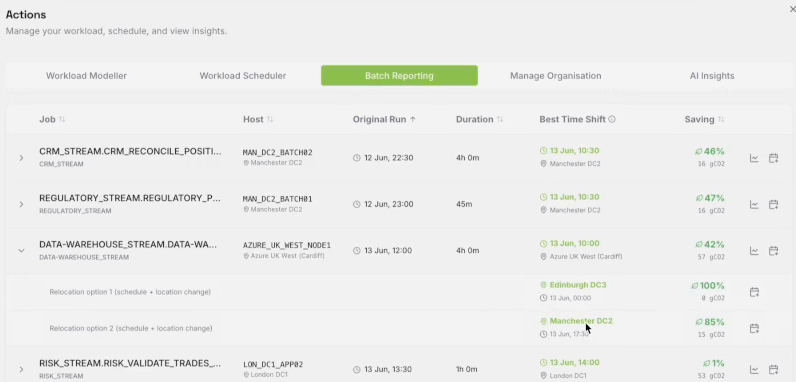
Export your schedule from BMC Control-M, Broadcom AutoSys or IBM Workload Scheduler and upload it as-is — GridIQ auto-detects the format, maps your hosts to their datacentre or UK cloud-region locations, and analyses hundreds of jobs in one pass.
Recommendations are reschedule-first: the greenest slot at the location each job already runs in, because shifting a start time is an ops decision, not an infrastructure project. Relocation options are there when you want them.
Control-M, AutoSys and IWS exports — plus plain CSV / Excel
Time-shift recommendations per job, with relocation alternatives
Per-job intensity timelines comparing your locations
Boardroom-ready report with kgCO₂e savings — export to CSV or Excel
For engineers
Built on real grid data, not a black box
GridIQ is built for the people who actually run the workloads — batch, ML training, ETL, fleet charging. Here's what's under the hood.
National Grid ESO data
Live and forecast carbon intensity from the official GB grid operator's API — refreshed every 30 minutes.
14 GB regions
Regional resolution, because the generation mix in Scotland and the South East are very different animals.
48-hour forecasts
Enough horizon to schedule tonight's training run or tomorrow's ETL window with confidence.
2+ years of history
Model where a new data centre, office or workload should sit before you commit to it.
Enterprise scheduler import
Control-M job reports, AutoSys autorep output and IWS plan extracts parsed natively — with host-to-location mapping built in.
Orgs, roles & alerts
Multi-site organisations, role-based access and threshold email alerts out of the box.
On the roadmap: automated execution hooks (Kubernetes, Airflow, Slurm), multi-cloud region mapping beyond GB, and ESG/compliance exports. Today, GridIQ tells you when — you trigger the run.
See it in action
Three minutes from job list to greener schedule
Prefer to read? Download the GridIQ overview — three pages on what it does, how it works and where it's going (PDF, 1.3 MB).
Ready to see your organisation's number?
We run a 6-week pilot against your real job list: agreed success metric, measured CO₂ result your sustainability team can report against. No procurement marathon to find out if it's worth it.
We'll walk through the platform against your own workloads and locations — and if it looks promising, scope a 6-week pilot on your real job list.
Personalised walkthrough of the platform
Run your actual job list through the scheduler
Customised CO₂-reduction estimates for your sites
Pilot scoped with an agreed, measurable success metric
† Based on National Grid ESO regional carbon-intensity data for all 14 GB grid regions, 10 August 2025 to 10 August 2026. Modelled as a 4-hour workload, comparing its scheduled window against the lowest-intensity 4-hour window available in the same region on the same day. Figures are medians across 365 days for the seven highest-intensity GB regions: 25% assumes ±6 hours of deadline flexibility, 40% assumes full-day flexibility. “More than eight days in ten” is the share of days on which a saving above 20% was available (82–92% depending on region). Tonnes per GWh are derived from the same dataset. Your own figure depends on your regions, run windows and deadline flexibility — a pilot measures it against your real schedule.